I. INTRODUCTION
Tourism is one of the most vulnerable sectors to global economic and financial crises, recession, terrorism, political shocks, natural disasters, epidemics, and pandemics (Collins-Kreiner and Ram, 2021). The tourism industry is a catalyst for the spread of the virus and its victims. Therefore, this sector is one of the hardest hit by the pandemic. The tourism industry has experienced several significant pandemics over the past few decades—most notably, severe acute respiratory syndrome (SARS) (2002–2004), novel influenza A (H1N1) (2009–2010), MERS (2015), and COVID-19 (2019-present) (Hu et al., 2021). During the COVID-19 pandemic, airlines were the biggest destroyer of value among all aviation subsectors, estimated to suffer an economic loss of 167.9 billion USD in 2020 (McKinsey & Company, 2022). In South Korea, the number of air passengers in 2020 and 2021 declined by 68.1% and 47%, respectively, compared to 2019. Losses are expected to be 39.4 million and 6.38 million (in U.S. dollars) in 2020 and 2021, respectively (KOTI, 2021). Given the possibility that such a crisis will occur again in the future, various precautions, such as secured financial resources, must be taken (Park and Jeon, 2020).
However, the air cargo sector has suffered comparatively less than the passenger sector, and it was expected that it would recover before the passenger sector (Wang et al., 2021). Except for freight forwarders and cargo airlines, all segments of the aviation value chain reported massive losses in 2020. These subsectors benefited from a rise in demand for air cargo. In 2020, both managed to generate healthy economic profits: For freight forwarders, 4%; and for air cargo carriers, 9% (McKinsey & Company, 2022). Despite the rapid decline in the passenger sector, air cargo exports in South Korea increased by about 4.4% year on year (January - April 2020) (Kim et al., 2020).
Therefore, this study aims to study the impact of the pandemic on passenger and cargo demand, separately, in the aviation industry in South Korea. It uses empirical data from Incheon International Airport. Furthermore, understanding the impact of the pandemic will be a basis for predicting air transportation demand to anticipate other pandemics in the future.
Accordingly, the remainder of this study can be categorized as follows. Section 2 provides an overview of relevant research and existing literature. Section 3 introduces the regression model framework and the dataset that is being studied. Section 4 reports the computational results, including the correlation coefficient between inputs and outputs, regression model performance, feature importance, and results analysis. An overview of future research directions is provided in Section 5.
II. LITERATURE REVIEW
The number of cases (infected patients) is used to assess the impacts of SARS and Avian Flu on international tourism demand to Asia, which showed the negative impact of SARS and the non-significant impact of Avian Flu on the number of foreign visitors (Kuo et al., 2008). In addition, the number of deaths is also used to assess the impact of COVID-19 on transport volume and freight capacity dynamics of food retail logistics in Germany, which showed a strong linear statistical relationship between dry product transport volume growth and the number of new COVID-19 cases (Loske, 2020).
Other than the number of cases and a number of deaths, the World Pandemic Uncertainty Index (WPUI) and Discussion about Pandemic Index (DPI) created by Ahir et al. (2018) are used to assess the impact of pandemics on tourism, which showed the negative impact of pandemic uncertainty and discussion on tourist arrivals in the long run (Kocak et al., 2022). In the case of South Korea, the number of cases of SARS and MERS and the distance to South Korea also showed a negative impact of the pandemic on the number of arrivals (Joo et al., 2019).
This study uses data from Incheon International airport to assess the impact of pandemic-related features including the number of cases, number of deaths, WPUI, and DPI of four major pandemics (SARS, H1N1, MERS, and COVID-19) on airline demands for passenger and cargo transportation. A regression machine learning model is then developed to predict airline demand for air transportation.
The purpose of this paper is to assess the impact of pandemic-related features on passenger and cargo demand in the aviation industry by examining four major pandemics. Brief information about the pandemic is presented in Table 1.
Severe acute respiratory syndrome (SARS) is a viral respiratory disease caused by SARS-associated Coronavirus. SARS is an airborne virus and can spread through small droplets of saliva in a similar way to the cold and influenza. The case fatality rate for persons with illness meeting the current WHO case definition for probable and suspected cases of SARS is around 3%.
The influenza A (H1N1) virus showed that it was derived from an animal influenza virus. After initial reports of an influenza outbreak in North America in April 2009, a new influenza virus spread rapidly throughout the world. By the time WHO declared a pandemic in June 2009, a total of 74 countries and territories had reported laboratory-confirmed infections.
Middle East respiratory syndrome Coronavirus (MERS-CoV) is a virus that is transmitted to humans from infected dromedary camels. As a zoonotic virus, it can be transmitted between animals and humans through direct or indirect contact with infected animals.
Coronavirus disease (COVID-19) is an infectious disease caused by the SARS-CoV-2 virus. Coughing, sneezing, talking, singing, or breathing can spread viruses in tiny droplets. These particles range from large respiratory droplets to smaller aerosols.
III. METHODOLOGY
This study builds several machine learning regression models, such as decision trees, random forests, K-neighbors, and XG Boost (the choice of a regression model is not a major concern in this study), to forecast air transportation demand during pandemic periods. Feature selection and parameter grid search are used to improve the performance of the model and cross-validation (70% of the training set and 30% of the test set) prevent the model from overfitting. The model with the highest performance based on the R-squared value is chosen for further analysis. The detail of the regression model framework is shown in Fig. 1.
An empirical dataset from Incheon International Airport in South Korea with 257 monthly data from March 2001 to July 2022 is used. The inputs of the model are pandemic-associated features as defined in Table 2. The pandemic-related features are focused on the four major pandemics from 2001 to 2022: SARS, H1N1, MERS, and COVID-19. The output of the model is features related to airline demand at Incheon International Airport in South Korea based on empirical from this study. The air transportation demands are separated into three categories, which are the total number of flights (Flight Total), the total number of passengers (Passenger Total), and the total number of cargo (Cargo Total).
IV. RESULT ANALYSIS
In this paper, a regression model with the highest performance based on the R-squared value will be chosen for further analysis to see the impact on feature selection. Feature selection will depend on correlation analysis between inputs and outputs. Furthermore, we will conduct regression analyses specific to airline demands such as domestic and international departures and arrivals.
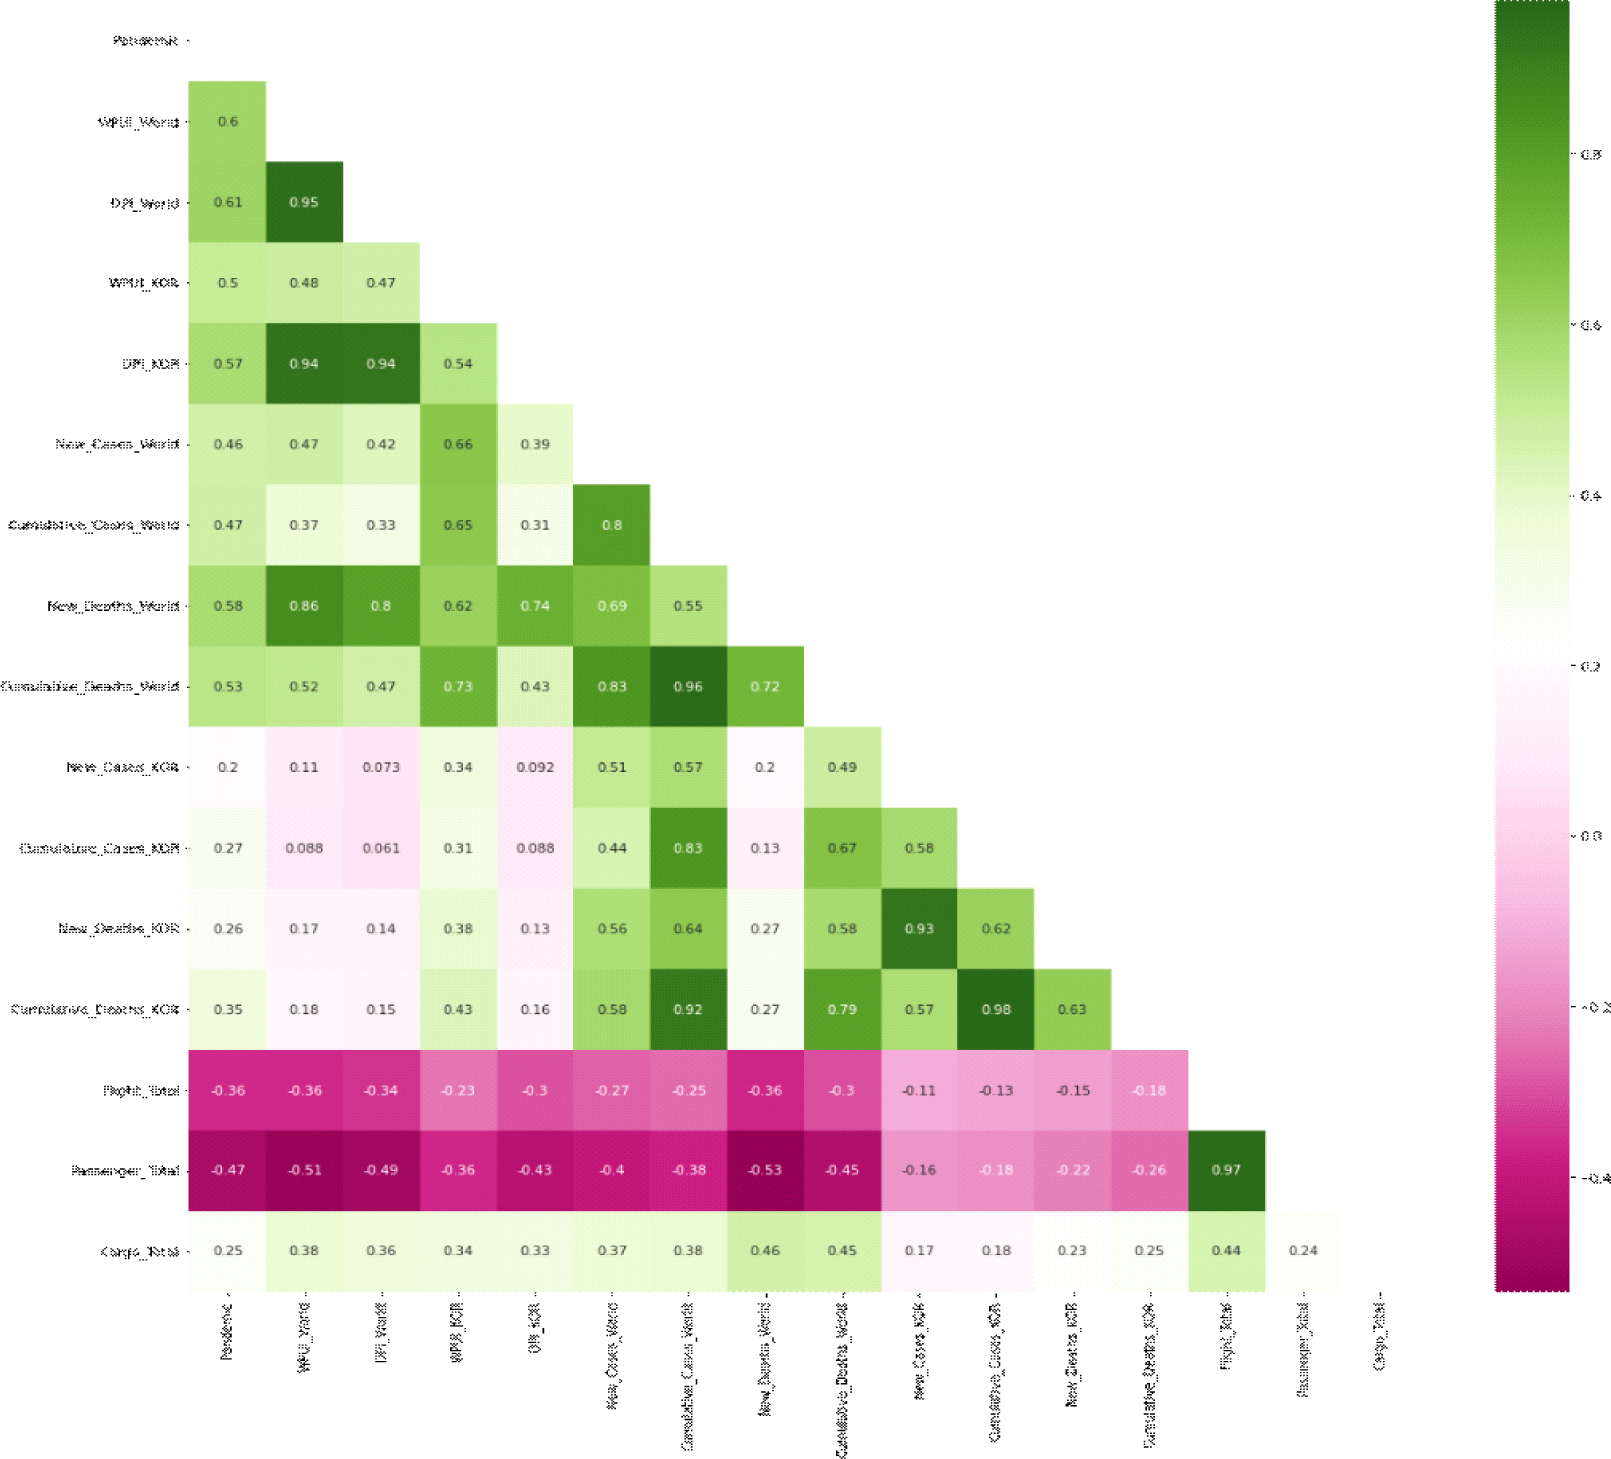
Based on the result shown in Fig. 2, all features of input have negative correlation with number of flight and number of passengers where overall have more negative correlation with number of passengers compared to number of flights, meanwhile has positive correlation with number of cargos.
The number of cases or deaths around the world has a higher correlation than the number of cases or deaths in only South Korea. Therefore, the number of cases or deaths in South Korea will be excluded from the regression analysis.
Based on the average R-squared value shown in Table 3, the XGBoost Regressor model gives the most accurate performance. Generally, the number of flights and passengers is similar, indicating a positive correlation between the two outputs as indicated on the heatmap.
Feature selection is conducted by excluding the pandemic-related features that have a lower correlation coefficient value, which is the number of cases or deaths in South Korea only (New_Cases_KOR, Cumulative_Cases_KOR, New_Deaths_KOR, Cumulative_Deaths_KOR). According to the average R-squared value shown in Table 4, the model performs better after the feature selection method is utilized, increasing by 2.1%, which accords with the heatmap result that indicates the world case has a higher correlation than the South Korea case alone.
| No | Model | Flight | Passenger | Cargo | Average |
|---|---|---|---|---|---|
| 1 | Before | 0.931 | 0.882 | 0.728 | 0.847 |
| 2 | After | 0.934 | 0.920 | 0.751 | 0.868 |
| Increment | 0.003 | 0.038 | 0.023 | 0.021 | |
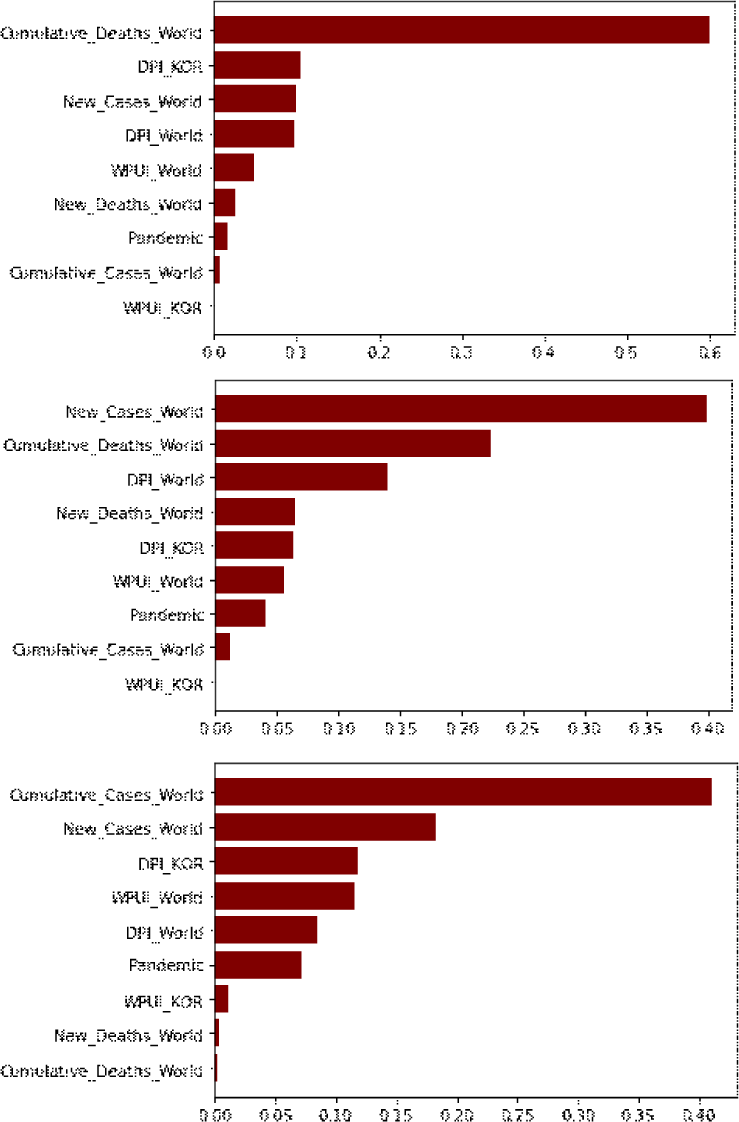
Based on the feature importance results shown in Fig. 3, the most significant features for flight, passenger, and cargo are different. DPI and WPUI have a high correlation with airline demand and death cases. In spite of this, WPUI_KOR is relatively less significant.
The average R-squared value shown in Table 5, for all sectors (flight, passenger, cargo) shows that domestic demand is less accurate than total demand, indicating that domestic demand is not significantly impacted by the pandemic. However, since domestic demand constitutes only a very small portion of total demand (less than 2%), overall, departure, and arrival demand that include domestic demand perform very well. The cargo sector has the poorest accuracy result for departure demand, which indicates that departure demand is less affected by the pandemic.
V. CONCLUSION
In spite of this, domestic demand constitutes only a very small portion of total demand (less than 2%), which explains why departure and arrival demand which includes domestic demand performs very well. In the cargo sector, departure demand has the poorest accuracy result, which suggests that the pandemic has had a lesser effect on departure demand.
Air transportation demand is known to be adversely affected by pandemics, specifically the number of flights and passengers; however, cargo is positively affected by them. Pandemic-related features are more negatively correlated with the number of passengers than the number of flights, which indicates that the number of passengers decreased more dramatically than the number of flights.
Additionally, using a feature selection method that excludes only the number of cases and deaths in South Korea (feature names: New_Cases_KOR, Cumulative_Cases_KOR, New_Deaths_KOR, Cumulative_Deaths_KOR), performance improvement is shown for the best model, which indicates that global conditions have more influence on air transportation demand than country conditions. In addition to the number of cases and deaths, WPUI and DPI have a strong correlation with air transportation demands. There may be an impact on air travel demand due to uncertainty about the pandemic and discussions about the pandemic.
Analyzing the details of air transport demands by analyzing domestic and international customers, as well as departures and arrivals, reveals that domestic and cargo departure functions less accurately than the total demand, which indicates that demand is less affected by the pandemic.
The further research agenda may consider the following aspects for improvement. First, the research only focuses on four major epidemics, including SARS, H1N1, MERS, and COVID-19. As a result, additional information about other pandemics might improve the performance of the model. Second, the pandemic-related features can be enriched with other information, such as global or regional travel policies. However, the information is limited for past pandemics other than COVID-19. Therefore, research focusing on COVID-19 might give a different perspective result. Lastly, the WPUI and DPI are built based on Economist Intelligence Unit (EIU) country reports, which might not capture the actual situation for certain countries like South Korea. Therefore, data mining from other resources such as social media might improve the model.


