I. INTRODUCTION
Modern civil aircraft are operated in a constant cycle of distribution and collaboration of tasks between two pilots within their given roles, to comply with flight procedures. The necessary knowledge and competencies for the tasks are acquired through a series of theoretical education, flight simulation training, and computer-based training (CBT).
Meanwhile, ICAO, IATA, and IFALPA have defined the eight core competencies required at all stages of the pilot's career, including Abinitio Training, Skill Test, and Recurrent Training and Evaluation, as shown in Table 1 [1]. A pilot's training and evaluation must include the eight core competencies, especially Situation Awareness (SA), which is an essential part of training and evaluating civil aviation pilots. In addition to allocating resources, making timely decisions, and managing workload, it also allows one to accurately assess the current condition of the aircraft. This allows one to determine its impact on operations.
This study was conducted as basic research on the development of a training program. It aiming to improve the pilot core competencies and to analyze the basic capabilities in SA and workload management of future pilots.
II. BACKGROUND
The term, SA is defined as recognizing environmental elements of time and space, understanding their meaning, and predicting their state for the near future [2]. Particularly, due to the complex nature of aircraft operation, a clear SA is essential for the pilot to accurately perform a given task.
Considering that most accidents are caused by human factors, specifically a pilot’s lack of situation awareness procedures, it is crucial for the pilot to recognize the aircraft’s condition and take the necessary action. Additionally, the pilot must be aware of what is likely to occur in the near future.
SA can be classified into three stages. Level 1 SA: Perception of elements in the environment. This is the lowest level of SA and is associated with the pilot’s perception of information from aircraft instrumentation, the behavior of the aircraft, other people in the cockpit, other aircraft in the sky, the terrain, and air traffic control. Level 2 SA: Comprehension of the current situation. A pilot's understanding of the elements can follow from their perception if the data can be integrated and synthesized to produce an understanding of their relevance to their tasks. Level 3 SA: Prediction of future status. The highest level of SA is associated with the ability to predict the future of elements in the environment. In particular, SA related to aircraft operation can be classified and defined as shown in Table 2.
A pilot's workload during aircraft operation may be significantly affected by the difficulty of each task and the number of tasks performed. In addition, it may be affected by the surrounding conditions or circumstances of the task. The phases of takeoff and landing are well known to be the phases involving the greatest workload for pilots [4].
The workload evaluation was performed with the NASA-TLX, developed by the NASA Ames Research Center (ARC), which is a widely adopted measurement in various fields for evaluating workloads. The NASA-TLX is made up of six subjects: Mental Demand, Physical Demand, Temporal Demand, Effort, Performance, and Frustration (Table 3) [5].
III. METHODOLOGY
This study was conducted on a total of 21 students from the Department of Aeronautical Science and Flight Operation at Korea Aerospace University. They had a basic understanding of flight simulation training devices, with no actual flight experience.
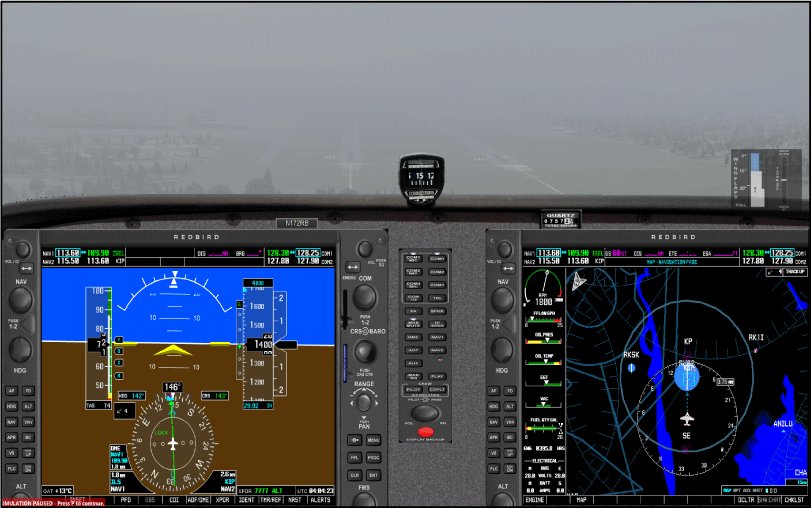
The Basic Aviation Training Device (BATD) Redbird TD2, with simulated Cessna 172S performance, was used to assess the SA and workload of student pilots [6].
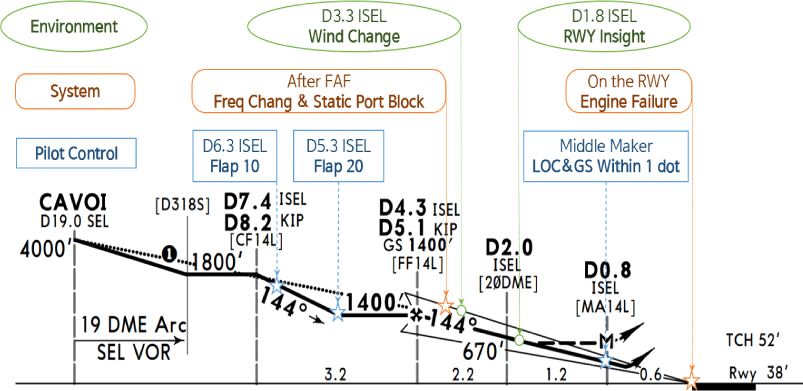
The flight scenario was built to simulate the precision approach and landing phase - with the highest workload - of Gimpo International Airport runway 14L, which the students have been trained on during the flight simulation class (Figs. 1 and 2).
During the ILS approach with a duration of around 5 minutes, several tasks were given to the students, including flap settings and handling abnormal situations. This included instrument malfunctions due to static port block and engine power loss, and environmental changes such as wind direction, strength, and visibility.
In this test, participants were asked to monitor a prerecorded video and the simulated evaluation flight, as a PM (Pilot Monitoring), and to maintain the SA of the flight by solving additional problems not related to the monitoring of the flight, such as answering common calculations during the monitoring in order to be exposed to a more demanding workload. Once the flight monitoring was complete, participants were asked to evaluate their workload via a survey.
The survey includes a series of questions related to major courses in the Department of Aeronautical Science and Flight Operation; disturbance factors during monitoring; flight situations recognized as PM; and NASA-TLX evaluations. R 4.2.2 was used to analyze the correlation of survey results, with t-test, Pearson (parametric test), and Kendall (non-parametric test) correlation analysis, depending on the type of data.
The following hypotheses were constructed in this study:
-
Hypothesis 1: There are correlations between the presence or absence of lessons similar to that of simulated flight practice, of the students, and the SA results and the NASA-TLX results.
-
Hypothesis 2: Differences in major subjects taken by the students will correlate with the SA results and the NASA-TLX results.
-
Hypothesis 3: The response rate of the disturbance factors will be correlated with the SA result and the NASA-TLX result.
-
Hypothesis 4: The SA result will be correlated with the NASA-TLX result.
IV. RESULTS
Among student pilots from the Department of Aeronautical Science and Flight Operations who participated in the study, only 24% of all students had experience taking simulation training courses. Most of the other participants had no experience with flight simulation devices. According to the results, they had taken 6 courses on average (minimum 3 and maximum 9) out of 15 major courses, which is 40%.
All participants responded 100% to the disturbance factors, and the average correct answer rate was 93.8 points, indicating a high level of accuracy. However, the SA result of the flight with disturbance factors was significantly lower. As a result of the total number of situations that occurred in the scenario, only 32.2% were recognized. Specifically, of the 32.2% that were recognized, 60.3% were geographical, which was the highest. This was followed by environmental at 33.3%, spatial/temporal at 27%, and finally system SA at 18%.
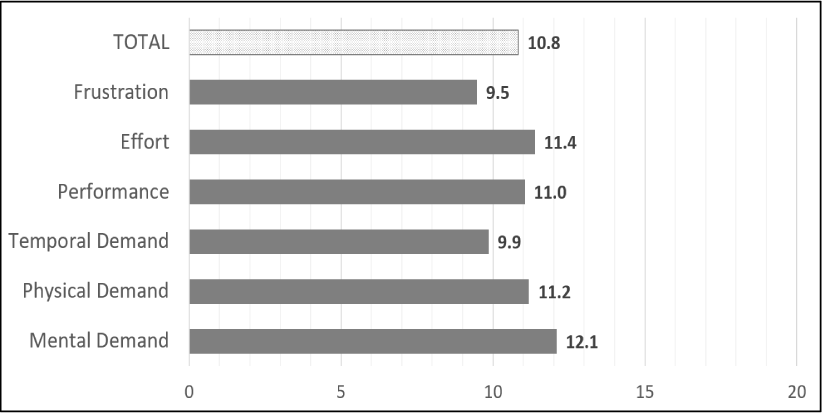
The overall workload score of the participants measured by NASA-TLX was 10.8 points out of 20 on average (Fig. 3). As for the workload scores for each item, it was found that students felt workload the most in the order of Mental demand (12.1 points), Effort (11.4 points), Physical demand (11.2 points) and Performance (11 points). However, the scores of Frustration level (9.5 points) and Time demand (9.9 points) were lower than the average indicating that the participants felt a relatively low workload in these areas.
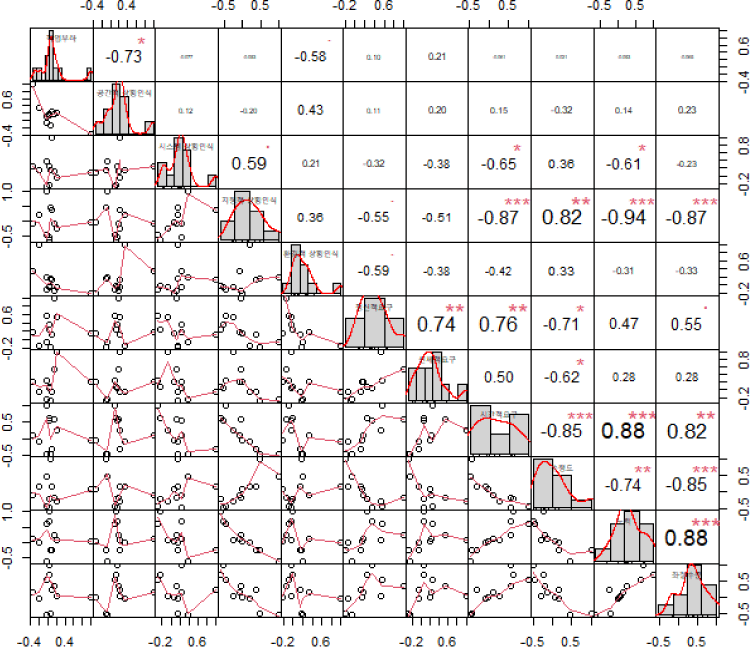
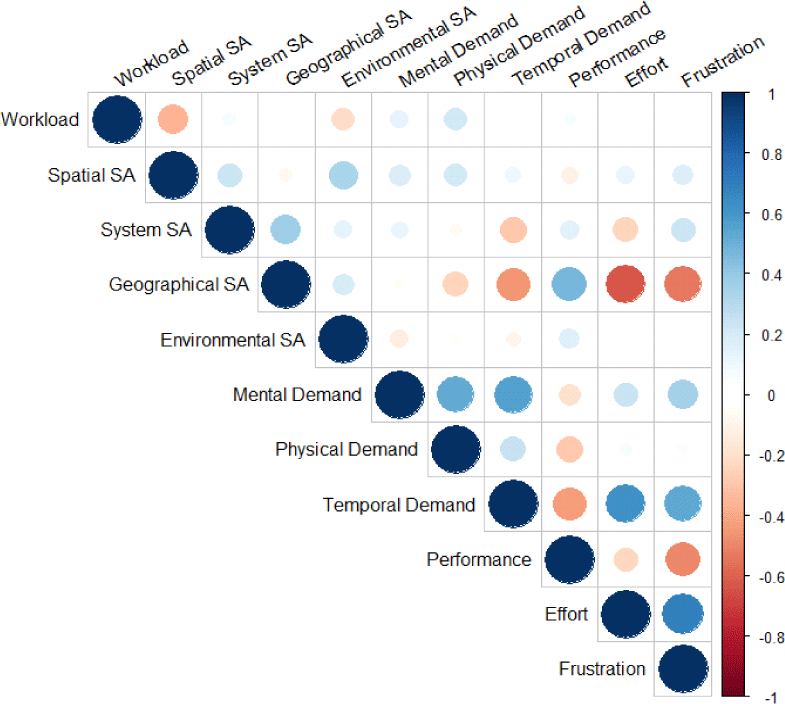
In order to analyze the correlation necessary for the verification of Hypotheses 1 to 4, normality verification was performed using the Shapiro-Wilk Normality Test. SA results (total score) and NASA-TLX results (total score) showed normality. A normal distribution was observed for all of the performance, effort, and frustration levels, with the exception of Mental demands, Physical demands, Spatial/Time demands, and Performance levels. The normality of the data was used to verify the hypotheses. The results for hypotheses 1 and 2 are below in Table 4, and the results for hypotheses 3 and 4 are shown in Figs. 4 and 5.
For Hypothesis 1, the p-value between the presence or absence of experience in taking flight simulation courses and the SA results was 0.261, and the value with NASA-TLX results was 0.359, which was not significantly correlated.
For Hypothesis 2, the major subject that had a significant correlation with SA results (p-value <0.05) was identified as 'Basic Air Navigation' (p-value: 0.01), and no major subjects had a significant correlation with NASA-TLX results. Among the detailed items of SA, geographical SA had a correlation with 'Basic Air Navigation' (p-value: 0.018).
For Hypothesis 3, the correlation coefficient of spatial SA for the response rate of the disturbance factor was –0.73*. Environmental SA was also found to be –0.58* showing negative correlations. However, there were no items that showed a correlation with NASA-TLX results.
Finally, in Hypothesis 4, it was shown that geographical SA had a significant correlation with NASA-TLX results. Geographical SA showed a strong negative correlation with Effort (–0.94**), Time demand, and Frustration level (–0.87**). On the other hand, it had a positive correlation with Performance (0.82**). Meanwhile, system SA had a negative correlation with Time demand (–0.65*) and Effort (–0.61*).
V. DISCUSSION AND CONCLUSION
This study was conducted to identify the basic competency of SA and workload as a PM in the precision approach and landing phase. It also used flight simulation training devices with experience for future pilot students. We also evaluated the Geographical, Spatial/Temporal, System, and Environmental SA, including itemized workload itemized Mental demand, Physical demand, Spatial/Temporal demand, Performance, Effort, and Frustration levels by using the NASA-TLX worklod evaluation method. The SA competency and workload evaluation results for future pilot students are as follows.
First, in the in-flight SA, the performance of student pilots with no actual flight experience was quite low, only 32.2%. The geographical SA, such as the location of the aircraft or the airport, was somewhat high at 60.3%. However, the system SA, such as instrument malfunction and engine failure, was only 18%, presenting a large gap with the geographical SA. This implies that, despite acquiring theoretical knowledge through major subjects and having experience with the equipment in flight simulation courses, there is a lack of ability to accurately recognize the operation of the aircraft system in practical operating situations.
Second, the result of evaluating workload as a PM through NASA-TLX was 10.8 out of 20 points, which is considered to be a normal level because it was evaluated without performing actual PM tasks such as checklist check, standard call-out, ATC communication, etc. It is estimated that the frustration level was low at 9.5 points due to the fact that anomalies were not recognized in the actual aircraft system.
Third, it was confirmed that taking 'Basic Air Navigation' among the major subjects was helpful in SA (p-value: 0.01), specifically in geographical SA (p-value: 0.018). It is also estimated that the theoretical knowledge acquired in basic air navigation helped to locate aircraft or navigation facilities. Although instrument flight practice subjects are expected to be very helpful in SA, the correlation was not significant due to the small number of students.
Fourth, intentional disturbances during flight monitoring negatively affected spatial/temporal SA (–0.73) and environmental SA (–0.58), indicating that distracting question-and-answer responses were significant obstructions to SA, which needs continuous monitoring for real-time changes.
Fifth, in the case of geographical SA, it had a significant correlation with the NASA-TLX results. The results of NASA-TLX indicate that the more numbers there are, the more intense the work demands, and the higher the level of geographical SA, the less workload for effort (–0.94), time demands, and frustration levels (–0.87).
Considering these results, it is possible to speculate that improving spatial perception, attention, memory, cognition, and mental/ physical health is still necessary in order to enhance SA. In addition, knowledge (understanding, trust, goal, prediction) should be acquired through training and experience, and efforts to further develop one’s competency should be accompanied by training. Above all, however, the evaluation of basic competencies should be prioritized for knowledge acquisition and training.
Based on the results of this study, it is anticipated that it will be possible to develop more efficient distribution hours for major subjects of the Department of Aeronautical Science and Flight Operations. Moreover, it can be utilized to develop training programs that can increase pilot core competencies.
A sufficient sample size of pilots with actual flight experience will enable future research to accumulate more comprehensive and meaningful data.


